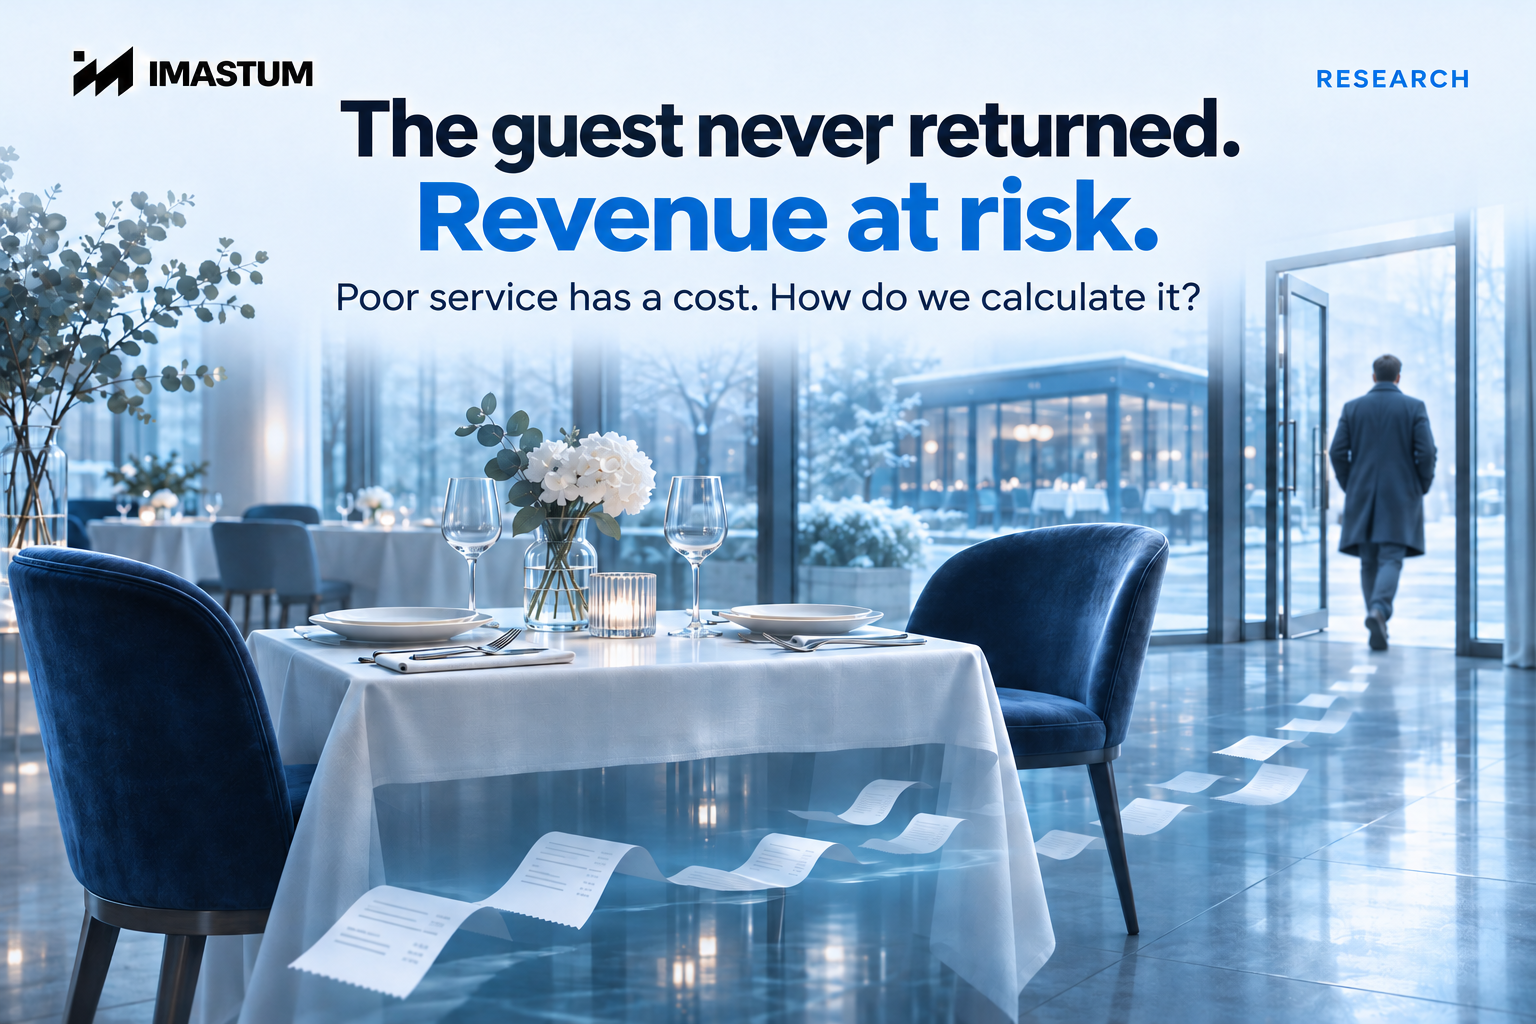
TASS published our research on risks in HoReCa, but a news story naturally leaves no room for the full version with all the maths. What if someone is interested?
In the TASS story featuring our figures, IMASTUM estimated that Russian establishments could put around RUB 193 billion in annual revenue at risk through a decline in product and service quality. Yet media headlines often sound categorical: they are already “losing” it. Our model is actually a little more nuanced and practical.
The full version of the author’s post of 24 June 2026, with explanations responding to questions in the discussion. The figures below describe a scenario model based on food-service turnover, not measured losses across the entire hospitality industry.
What restaurateurs and hoteliers should understand about this analysis:
1. RUB 193 billion is revenue at risk, not a net contraction of the market
The money does not necessarily disappear from the industry. A guest often does not stop eating out, but switches venues. That is the cost of getting it wrong: if quality declines, some regular customers may move to stronger competitors. Market share is redistributed (thank you, Captain Obvious).
A 10% decline in quality here means a change in a predefined quality indicator. It is not a universal threshold beyond which all customers start leaving. We explain below how such an indicator can be constructed and tested.
2. This is a flexible model, not a dogma
The headline figure is the baseline scenario in our sensitivity table. The model is built from the top down: the original calculation uses a base of RUB 4.3 trillion, a repeat-customer revenue share of 60% and the assumption that deteriorating quality affects half the market. These shares and the sensitivity coefficient are scenario inputs, not universally measured characteristics of every establishment.
Revenue at risk = market turnover × repeat-customer revenue share × share of turnover at affected establishments × relative decline in the quality index × sensitivity coefficient.
Baseline scenario: RUB 4,300 billion × 0.6 × 0.5 × 0.10 × 1.5 = RUB 193.5 billion. The original headline used an estimate of around RUB 193 billion. The 0.5 share refers to the turnover of affected establishments: half the establishments by number do not necessarily account for half the turnover.
If the affected share of turnover is 30%, with all other parameters unchanged, the risk is RUB 116.1 billion; at 70%, it is RUB 270.9 billion. This refines the rough “RUB 100–300 billion” range in the original post. Changing any input assumption changes the result.
3. Where will the model not work?
Where there is almost no repeat business. For example, at some roadside venues serving mostly one-off customers, the model will estimate a lower risk specifically to repeat-customer revenue. That does not mean poor service is harmless there: it may affect reviews, recommendations, conversion of new customers and other metrics not included in this formula.
The original post cited a scenario of up to RUB 544,000 per month, or around RUB 6.5 million per year, for a mid-range restaurant. Without the underlying revenue, repeat-sales share and sensitivity coefficient, this is not a reproducible estimate for an “average restaurant”. A separate example with all inputs is provided below.
The main takeaway
In a crisis, the instinct is to cut everything, including the product and standards. But a consumer on a tight budget may become especially discerning. “Good enough” is not always something they are willing to pay for.
The point of the calculation is not to declare a future loss inevitable. It helps identify how much repeat-customer revenue is sensitive to quality and compare scenarios before cost-cutting turns into customer attrition.
Questions from the discussion: how do you put a monetary value on poor performance?
What about interest rates, taxes and falling demand?
Interest rates, taxes and macroeconomic demand matter, but are not included in this model. We deliberately examine a separate, controllable factor: product and service quality. A restaurateur can influence it directly. The calculation does not prove that service explains all business losses, nor does it replace analysis of external factors.
How can I apply the calculation to my own restaurant?
For an individual business, the formula is similar, but the parameters must be its own:
Annual revenue at risk = annual revenue × repeat-customer revenue share × relative decline in the quality index × sensitivity coefficient.
For example, a restaurant with annual turnover of RUB 120 million, a repeat-customer revenue share of 65%, a 10% decline in the selected quality index and a scenario coefficient of 1.5:
RUB 120 million × 0.65 × 0.10 × 1.5 = RUB 11.7 million per year.
This is not “money missing from the till tomorrow”, nor guaranteed customer attrition over 6–12 months. It is estimated annual revenue at risk under the stated assumptions. The actual impact, timing and reasons for changes in sales must be checked against the establishment’s data.
What does “quality fell by 10%” mean?
A measurable indicator must be defined in advance. It could be a normalised quality index where the initial state is set to 100 and the new value is 90. Under that definition, the relative decline is indeed 10%.
The index might include CSAT (customer satisfaction), NPS (willingness to recommend), ratings on maps and aggregators, and cleanliness and service audit results. But these indicators have different scales and meanings. They cannot simply be added or averaged: normalisation rules, weights, comparable periods and verification of the relationship with repeat purchases are needed.
The discussion included examples of 8.5 → 6.8 and 4.6 → 3.9. Arithmetically, these are declines of 20% and approximately 15.2%, not 10%. Even a correctly calculated change in rating does not prove an equivalent percentage decline in service or a universal attrition threshold.
Where do the repeat-customer revenue share and the 1.5 coefficient come from?
The repeat-customer revenue share is estimated from point-of-sale, CRM and loyalty programme data: how much revenue came from customers who had purchased before. It should not be replaced with the share of repeat customers or visits without checking the average transaction value. The baseline scenario uses 60%; an individual establishment needs to measure its own value.
The 1.5 coefficient in this calculation is a scenario assumption about the sensitivity of repeat-customer revenue to the quality index. It must not be presented as a verified elasticity for the entire food-service industry. A data-based estimate requires comparable observations and controls for seasonality, prices, promotions, competitors and other factors.
Classic work on loyalty shows why customer retention matters. For example, Bain discusses the association between a 5% improvement in retention and a 25–95% increase in profit in the businesses studied. But profit and retention are not the same as revenue and a quality index. Those figures do not establish our 1.5 coefficient or a universal sensitivity range for restaurants.
What if some turnover is off the books?
The quality of the source data does constrain the calculation. The RUB 4.3 trillion base comes from the original scenario and is not presented here as the current market size. You cannot automatically add a presumed “grey” share and increase the risk proportionately: official statistics may already include adjustments, while the scale and behaviour of unrecorded turnover require separate verification.
For an individual business, it is important to agree which revenue the model covers and how fully that revenue is reflected in management accounts. Otherwise, the apparent precision is misleading.
Does this work in a small town?
The model can be used as a scenario framework, but its parameters cannot be transferred mechanically. A small town may offer fewer alternatives and word of mouth may have more influence. A customer may choose a competitor, visit less often or forgo a purchase. The direction and strength of the effect depend on the local market.
The repeat-customer revenue share and sensitivity to quality must be estimated locally. We cannot assume in advance that repeat-customer revenue in a small town necessarily accounts for 70–80%, or that attrition is always stronger or weaker.
Doesn’t the customer decide whether the service is worth the money?
Exactly. When guests do not understand what they are paying for, they compare the price with the alternatives available to them. Even atmosphere and a good product do not always compensate for a sense of unfair pricing or neglect. But one guest’s story explains a possible decision mechanism; it does not prove the scale of losses across an entire industry.
How does revenue at risk differ from the cost of poor quality?
There is another way to calculate the consequences of poor performance: direct costs of write-offs, rework, returns, compensation and correcting mistakes. These form part of the cost of quality and the cost of poor quality. That is different from our estimate of future repeat-customer revenue at risk.
Strong operators look at both measures. But they should not be added without checking: the same mistake could be counted twice. Nor can a universal loss percentage for manufacturing companies be automatically applied to a restaurant or hotel.
Original author’s material: Telegram post. Explanations have been added in response to questions in the discussion; the arithmetic and limits of interpretation were clarified when preparing the full website version.